Let’s Make a Metric for Triple-Willingness
One of the more underrated plays in baseball, in this blogger’s humble opinion, is the “hustle double.” When a player tries to squeeze an extra base out of what appears to be a single off the bat, fans get to see what might have been a “pedestrian” hit turn into a tight play. They see the defense get tested and, when successful, a runner end up in scoring position for his troubles. Generally speaking, when players are moving at greater speeds on any given play, interesting things are happening.
Triples, meanwhile, feature a lot of those same themes as hustle doubles. Unfortunately, triples are in explicit decline these days. While classifying doubles as being of the hustle variety or not isn’t an exact science, one might make an argument that the healthy majority of triples feature a fair dose of hustle.
Upon pondering these events – stretching one base into two, and two into three, that is – I wondered who in particular is sticking their necks out on the base paths these days. To this end, I delved into triples. More specifically, who is regularly stretching for three bases where others might settle for two?
A couple different pieces of data were necessary to address this question. First, data for ballparks; given that no two ballparks are the same and thus permit extra base hits to varying degrees, i.e. park factors. Next, data for player speed. Of any characteristic, foot speed seems the most likely to impact an individual’s proclivity to reach for 90 more feet. Finally, age data was included too as it is reasonable to assume younger (faster?) players are stretching their luck more regularly.
Some thoughts on that data, because it’s rather disparate. Data for player-seasons with corresponding batter ages and statistics comes from Baseball Reference. Player-season sprint speed data was taken from Baseball Savant. For park factors, I made use of the “Guts” section of FanGraphs. With all that data on hand, some (ugly) wrangling was done in Google Sheets to join it on the player-season level. When all was said and done, there was data for 396 player-seasons from 2021 to 2023.
The measure of choice for quantifying “triple-willingness,” let’s call it, is a simple one: triples all over doubles plus triples, i.e. 3B/(2B + 3B). The thought being that a triple is really just something resembling a hustle double, but extended 90 feet. My admittedly unchecked assumption here is that, on average, triples are hit no harder or at distinctly different angles than doubles, so examining the “percentage of non-home run extra base hits that go for triples” captures that willingness without being confounded by how the ball was actually struck.
Now there are any number of ways to have evaluated “triple-willingness”; what is outlined above surely isn’t the best way by any means, but seems to be a reasonable proxy given the nuance of such a notion.
That said, delving into the data provided some unexpected results; namely, the ratio of triples to non-home run extra base hits did not correspond to other aforementioned player attributes (sprint speed, home ballpark, age) like one might reasonably expect.
Very simply, there was no relationship between 3B/(2B + 3B) and sprint speed OR a hitter’s home ballpark’s hitter friendliness for triples. The correlations between 3B/(2B + 3B) and those is -0.06 and 0.06, respectively. Neither are statistically significant when used as explanatory variables in a simple linear regression model estimating 3B/(2B + 3B).
This came as something of a surprise. There are obviously some problems with park factors, namely that only a hitter’s home park was accounted for and that handedness within that park wasn’t accounted for at all. Additionally, sprint speed itself is nuanced and may not fully capture any given player’s max speed. No context is considered: who might be on base when players are hitting, if anyone, etc. Still, that sprint speed is weakly negatively correlated with 3B/(2B + 3B) (as well as with raw count of triples) comes as an unexpected twist.
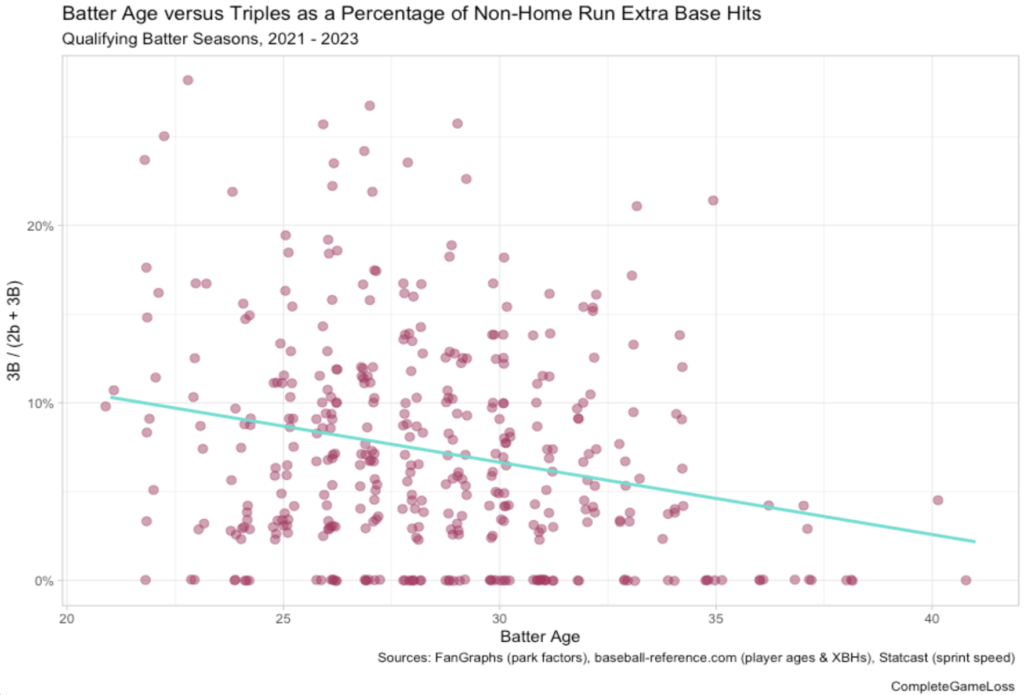
What does correlate to 3B/(2B + 3B)? Why, batter age, of course. While it sure doesn’t do so perfectly, age does appear to relate in some way to the fraction of non-home run extra base hits that end with a hitter on third versus second. The correlation between age and 3B/(2B + 3B) is -0.24. Put another way, as players get older the more unlikely they are to turn that ball deep in the gap into three bases versus two.
A simple linear regression model also indicates that batter age is a statistically significant explanatory variable for 3B/(2B + 3B). It suggests that with each additional year of age, any given player’s likelihood of making their non-home run XBH a triple decreases nearly half a percentage point (holding all else equal and with heaps of other nuance to qualify and hedge with).
Thus, without further ado, the only chart in this piece, which visualizes that relationship with a linear regression line included.
Should I extend this exercise, I believe contract status may be another interesting variable to consider. In the same way that stolen bases are sometimes considered too high risk for stars, stretching beyond doubles may too be slightly discouraged among older (and better paid) players. In any event, this data would suggest that putting one’s head down and blowing past second, it turns out, is a more often a young man’s play.


